




Introduction:
This article focuses on EEG findings during general anesthesia with a sevoflurane-based technique. Inhaled ether anesthetics have complex effects on the CNS and, despite widespread use, their mechanism of action is not fully understood. While the primary hypnotic effect is the result of increased GABA-A activity, sevoflurane’s effects are much more widespread. The drug potentiates GABA-A, glycine, and two-pore potassium channels, and it inhibits voltage-gated potassium, NMDA, muscarinic and nicotinic acetylcholine, serotonin, and α-amino-3-hydroxy-5-methyl-4-isoxazolepropionic acid channels.1,2 Much like propofol, halogenated vapors generally disconnect cortical regions (such as the prefrontal cortex and parietal cortex), directly inhibit cortical activity and hyperpolarize the thalamocortical circuit. Effects on the cortex generate delta frequency EEG, while thalamocortical projections lead to rhythmic alpha oscillations. Sevoflurane is believed to impact indirect projections between the suprachiasmatic nucleus, dorsomedial hypothalamic nucleus and locus coeruleus, which function as an arousal system in the brain. Additionally, sevoflurane acts on brain regions and circuits more broadly, which is well beyond the scope of this article.3 It is believed that non-GABAergic effects lead to theta activity, a characteristic of halogenated vapors.1,4
Case 1:
A 33-year-old man who presents for emergent repair of an incarcerated hernia. His medical history includes hypertension and a liver transplant two years prior for alcoholic cirrhosis. Frontal EEG is placed post-induction and prior to surgery start. Sevoflurane is the primary maintenance anesthetic.
EEG data for our cases are displayed in raw EEG and density spectral array (DSA) formats. The amplitude resolution on raw EEG is set at 10 µV/mm. With regards to the DSA, frequency is on the y-axis and time on the x-axis. Frequency of brain activity is quantified by color changes, with blue representing the lowest power, red representing the highest power with intermediate powers ranging from green to yellow. The DSA allows useful visualization of the EEG power of frequency over time in a two-dimensional display.4

Figure 1:
Figure 1A demonstrates the EEG at the time of initial placement while administering 0.7 age-adjusted MAC with sevoflurane. The DSA shows high-power bands in alpha and delta frequencies.4 While at these low concentrations, the DSA of sevoflurane can resemble a propofol signature. As the concentration of sevoflurane is increased to 1.0 age-adjusted MAC in preparation for surgical incision, theta power is increased. This occurs around 0125 (the red arrow) in the DSA in Figure 1A. Maintenance with 1.0 age-adjusted MAC of sevoflurane shows a near-uniform high-power band between delta to alpha frequencies, which is depicted in Figure 1B, highlighted in the red box.4

Figure 2:
Figure 2 shows differing parameters of the power spectrum range (measured in decibels). This image highlights the importance of recognizing the effects of the power range settings on the visualization and interpretation of the EEG data. The default power spectrum range of 10 to –40 decibels is depicted in the middle panel shown inside the red rectangle. This is the same scale as shown in Figure 1. The parameters changed are displayed with larger black font above or below the corresponding DSA.
Figure 2A depicts changes in the high-power scale parameter, ranging from 0 in the first panel, 10 in the second panel (default setting), and 20 in the third panel. The low power parameter is maintained at –40.
Figure 2B shows changes in the low power scale parameter, ranging from –50 in the first panel, to -40 (default setting) in the second panel, and –30 in the third panel. The high-power parameter is maintained at 10.
Case 2:
A 28-year-old healthy woman presented to the preoperative holding area for laparoscopic cholecystectomy. Her past medical history was noncontributory. She does not take any prescription medications or use illicit drugs.
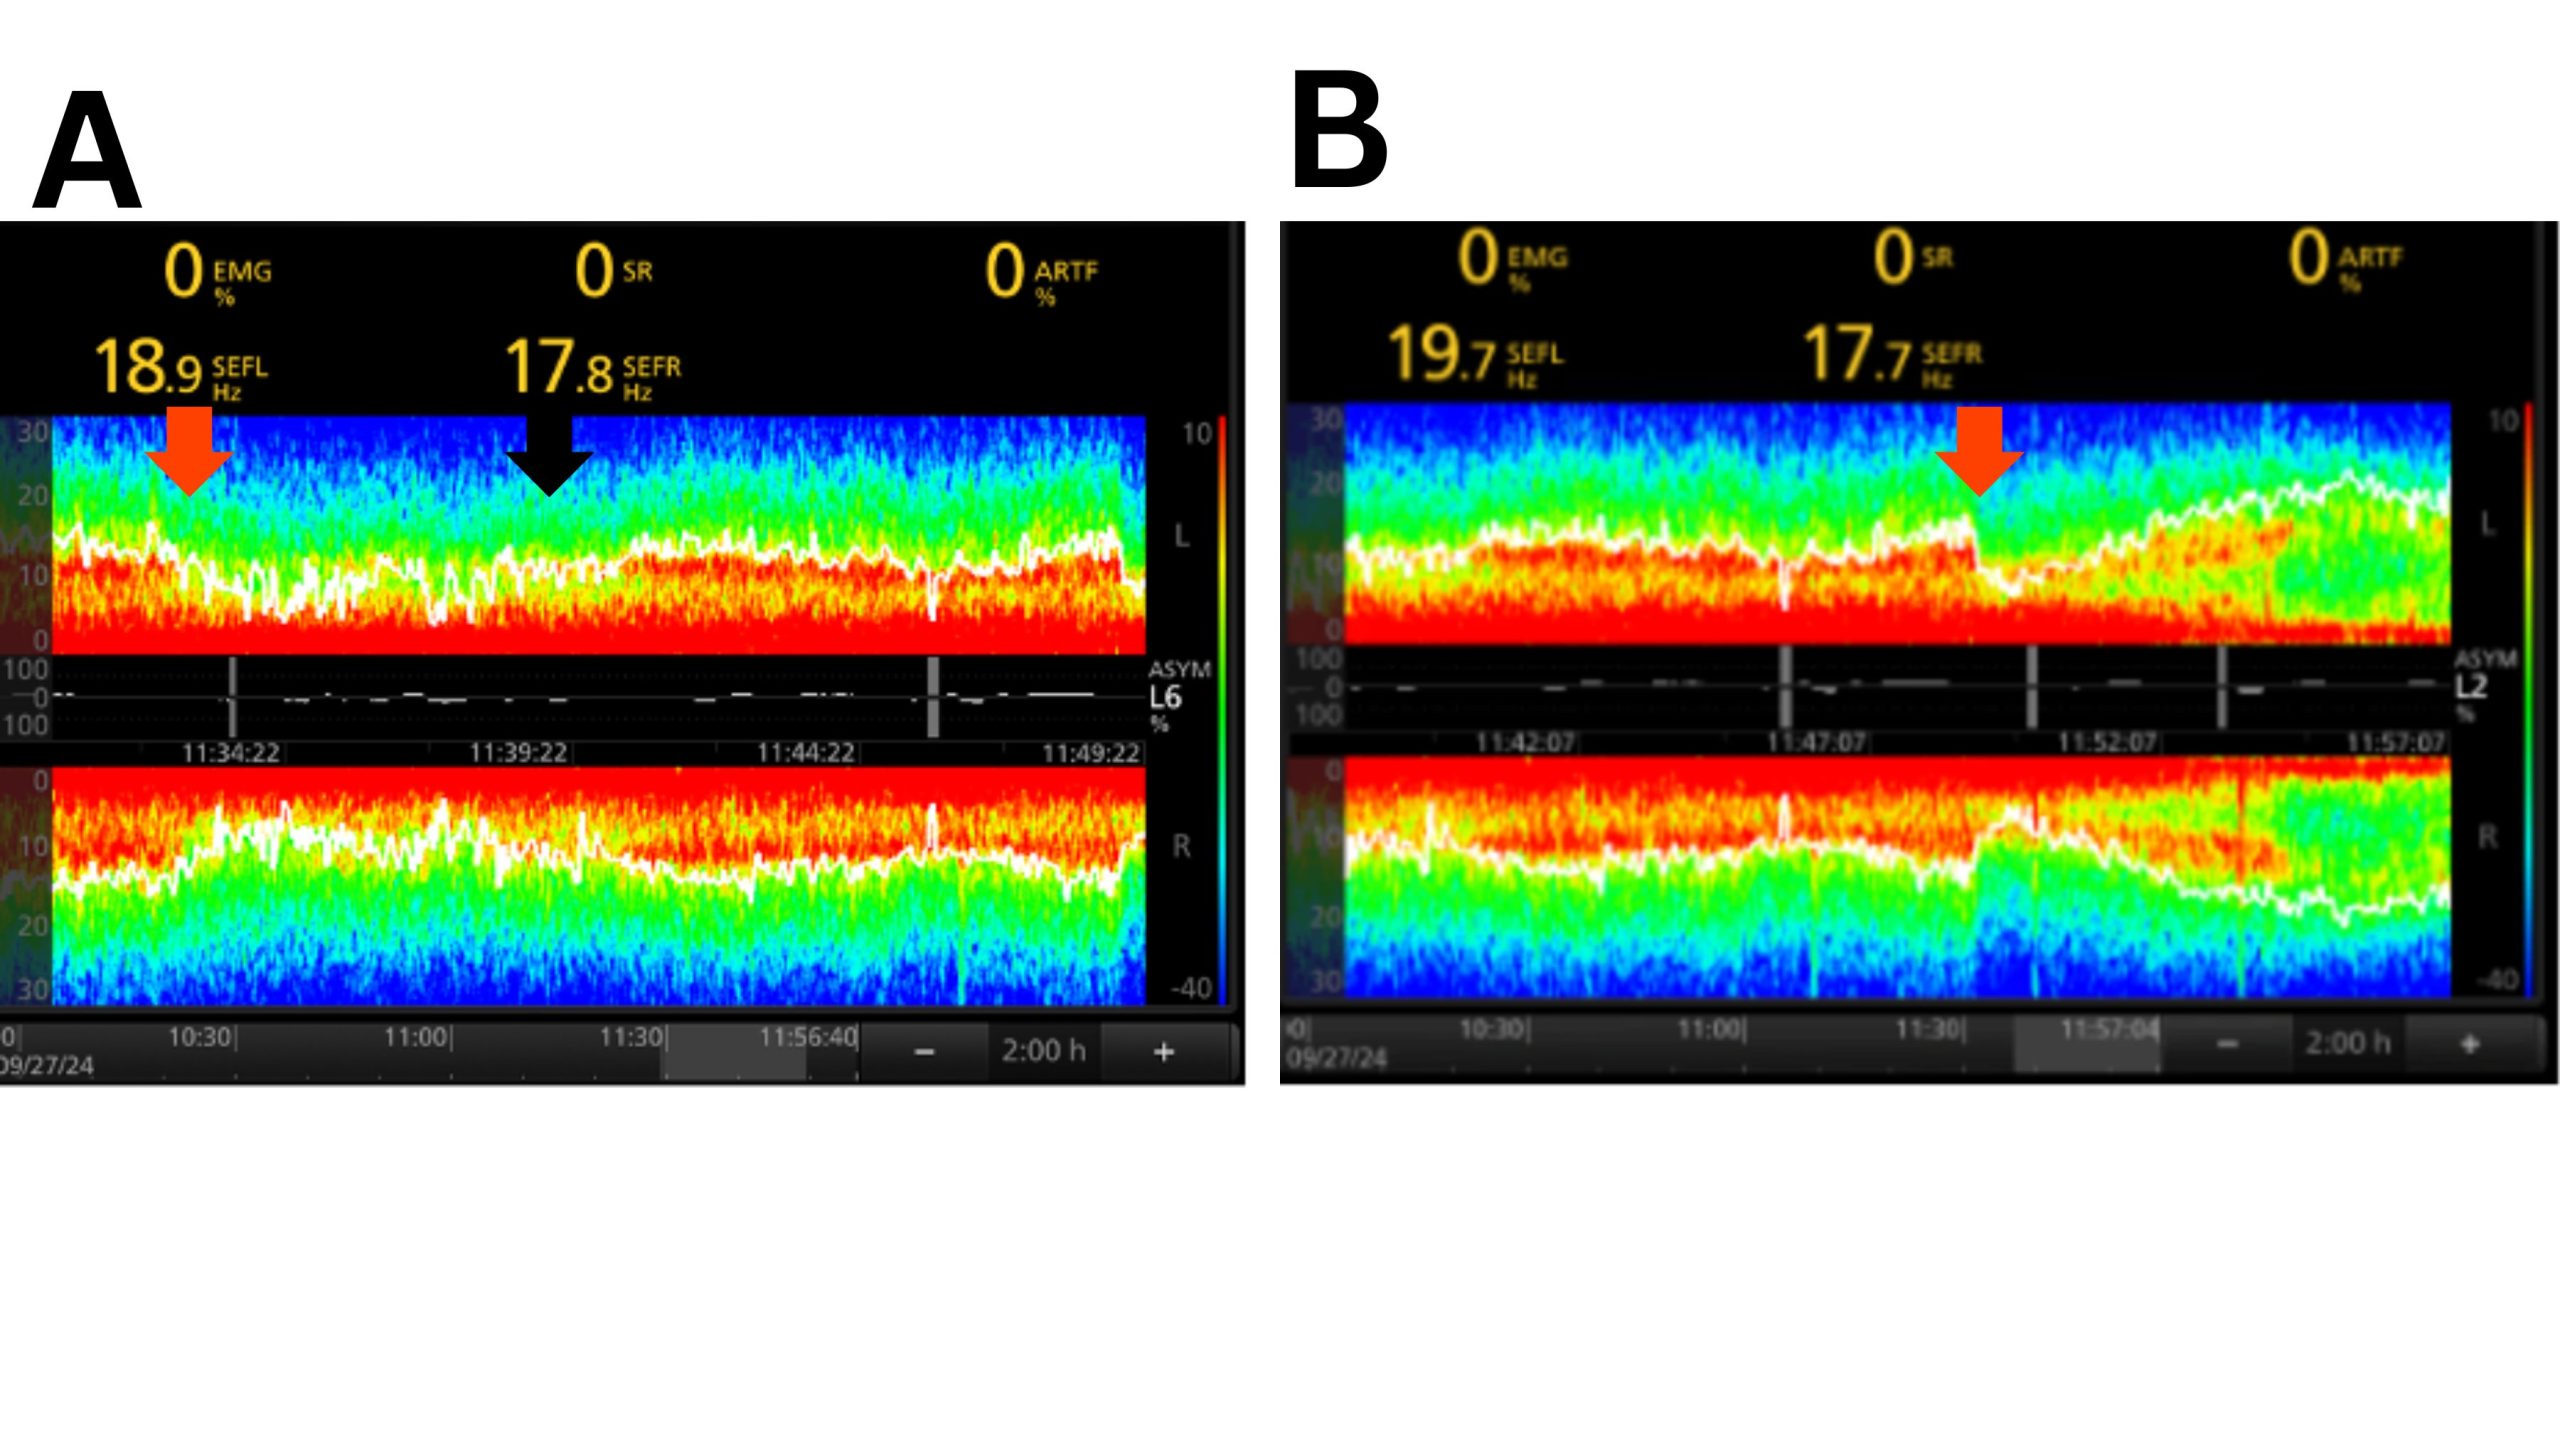
Figure 3A: At approximately 1133 (red arrow), alpha drop out occurs. This was accompanied by a modest increase in heart rate but no change in blood pressure. Opioids were administered at around 1139 (black arrow) with quick return of alpha power. 3B: At approximately 1150 (red arrow), emergence begins. Theta and alpha power dissipate, while beta power begins to appear. This pattern has been described as “unzipping.”
Conclusion:
The DSA during general anesthesia with a sevoflurane-based technique at less than one MAC resembles propofol with high power bands in alpha and delta frequencies.4 Increasing the dose of sevoflurane (generally at one MAC or greater) can lead to high power in the theta frequencies and, as in case 1 (above), nearly uniformed red-intensity power between delta to alpha frequencies on the DSA.
Case 2 demonstrated two additional principles. Alpha dropout can be seen following a nociceptive pain stimulus. The Summer 2024 newsletter covered nociceptive changes on EEG in detail (https://snacc.org/eeg-case-nociceptive-eeg-changes-under-general-anesthesia/). On emergence, theta power decreases followed by a pattern described as “unzipping,” as delta and alpha power decrease. This progression from a delta-dominant state to a period of spindle dominance followed by a non-slow-wave state before emergence has been associated with the lowest risk of delirium.5
References:
- Akeju O, Westover MB, Pavone KJ, Sampson AL, Hartnack KE, Brown EN, Purdon PL. Effects of sevoflurane and propofol on frontal electroencephalogram power and coherence. Anesthesiology. 2014 Nov;121(5):990-8.
- Mapelli J, Gandolfi D, Giuliani E, Casali S, Congi L, Barbieri A, D’Angelo E, Bigiani A. The effects of the general anesthetic sevoflurane on neurotransmission: an experimental and computational study. Sci Rep. 2021 Feb 22;11(1):4335.
- Lyu J, Cai H, Chen Y, Chen G. Brain areas modulation in consciousness during sevoflurane anesthesia. Front Integr Neurosci. 2022 Dec 21;16:1031613
- Patrick L. Purdon, Aaron Sampson, Kara J. Pavone, Emery N. Brown; Clinical Electroencephalography for Anesthesiologists: Part I: Background and Basic Signatures. Anesthesiology 2015; 123:937–960.
- Hesse S, Kreuzer M, Hight D, Gaskell A, Devari P, Singh D, Taylor NB, Whalin MK, Lee S, Sleigh JW, García PS. Association of electroencephalogram trajectories during emergence from anaesthesia with delirium in the postanaesthesia care unit: an early sign of postoperative complications. Br J Anaesth. 2019 May;122(5):622-634. doi: 10.1016/j.bja.2018.09.016. Erratum in: Br J Anaesth. 2019 Aug;123(2):255.